Deploy a Smart Home Monitor: Fly.io to Self-Hosted
Build a Python smart home monitor with Tuya, Redis, MongoDB, and Telegram. Then migrate from Fly.io to your own server with zero recurring costs.
My electricity bill kept climbing every month. I suspected my water pump was running longer than it should. It would kick on at odd hours and I had no way to know how long it stayed on. I wanted data. Not a smart speaker, not an off-the-shelf sensor app. I wanted something I built myself, that stored data my way, and told me exactly what I needed to know.
That problem turned into a small Python daemon I now call the smart home monitor. It polls a Tuya-connected power plug every 60 seconds, detects when the pump turns on or off, writes session data to MongoDB, and sends a Telegram alert the moment anything changes. No dashboard needed. Just a message on my phone.
This article is the full story of building that tool, deploying it to Fly.io, discovering the cost, and moving it to my own server instead.
What the Monitor Does
The system has one job. It watches a smart plug and tells me what is happening with my pump.
Every 60 seconds it reads the current wattage from the Tuya Cloud API. If the watt reading crosses a threshold of 100 watts, the pump is considered on. If it drops below that line, the pump is off.
That simple check drives a state machine with three transitions.
When the pump turns on, the system creates a new session document in MongoDB and sends a green Telegram alert with the current wattage and voltage. When the pump is still running, it appends a new reading to the session. When the pump turns off, it finalizes the session with calculated stats including total energy used and estimated cost in Indonesian Rupiah, then sends a red Telegram alert.
All state is stored in Redis under a single key. The Tuya API response is also cached in Redis for 50 seconds to avoid hammering the API on every cycle.
Architecture at a Glance
The project lives in two Python files.
main.py starts a minimal HTTP health server on port 8080 and runs the polling function immediately on startup. Then it hands control to APScheduler, which fires the function every 60 seconds using the Asia/Jakarta timezone.
monitor.py contains all the business logic. It manages three singleton connections, one each to Redis, Tuya, and MongoDB. If any connection fails, it resets to None and reconnects on the next cycle. That pattern keeps the daemon alive without manual intervention.
Here is the core polling function in simplified form.
def check_pompa_satelit() -> None:
    r = _get_redis()
    state = _load_state(r)
    status = _fetch_device_status()

    if status is None:
        return

    watt = status["watt"]
    is_on = watt > ON_THRESHOLD
    now = _now_ms()

    if is_on and not state["isOn"]:
        _save_state(r, {"isOn": True, "sessionId": "pending", ...})
        _bg(_on_pump_on, now, watt, ...)

    elif is_on and state["isOn"]:
        _bg(_on_pump_still_on, state.get("sessionId"), now, watt)

    elif not is_on and state["isOn"]:
        _save_state(r, {"isOn": False, "sessionId": None, ...})
        _bg(_on_pump_off, state, readings, now)
The background handlers run in daemon threads so they never block the scheduler. MongoDB writes and Telegram messages happen in the background while the main loop keeps polling.
Energy Calculation
When a session ends, the system calculates total energy using trapezoidal integration over the readings array. This gives a more accurate result than simply multiplying average power by time.
total_wh = sum(
    ((readings[i]["watt"] + readings[i-1]["watt"]) / 2)
    * ((readings[i]["timestamp"] - readings[i-1]["timestamp"]) / 3_600_000)
    for i in range(1, len(readings))
)
total_kwh = total_wh / 1000
cost_rupiah = total_kwh * PLN_TARIFF
The tariff constant is set based on the current Indonesian electricity rate. The result goes into the final Telegram alert along with session duration, average watts, and total energy consumed.
Code Review Before Deploying
Before touching any cloud infrastructure, I ran a syntax check on both files.
python3 -c "import ast; ast.parse(open('main.py').read()); print('main.py OK')"
python3 -c "import ast; ast.parse(open('monitor.py').read()); print('monitor.py OK')"
Both passed clean. I also reviewed the logic for edge cases. The state machine correctly handles the case where the device status is unavailable. It skips the cycle without changing state, so a temporary API failure does not corrupt the session.
Also Read: OpenClaw Remote Setup: SSH Tunnel and PM2
Deploying to Fly.io
I packaged the app in Docker. The Dockerfile uses the official Python slim image, installs dependencies in a separate layer for caching, and runs the app as a non-root user.
FROM python:3.12-slim
WORKDIR /app
COPY requirements.txt .
RUN pip install --no-cache-dir -r requirements.txt
COPY . .
RUN useradd -r -u 1000 app && chown -R app:app /app
USER app
EXPOSE 8080
CMD ["python", "main.py"]
The fly.toml file sets the primary region closest to the Tuya API endpoint and configures the machine as a persistent worker that never auto-stops.
app = "your-app-name"
primary_region = "sjc"

[http_service]
  internal_port = 8080
  force_https = true
  auto_stop_machines = "off"
  min_machines_running = 1
  max_machines_running = 1

[[vm]]
  cpu_kind = "shared"
  cpus = 1
  memory_mb = 256
I created the app via the Fly.io MCP server, set all environment variables as secrets, and deployed using the CLI. The build took about a minute and the logs showed a successful poll within seconds of launch.
The Duplicate Machine Trap
Fly.io creates two machines by default for high availability. That sounds good but it is wrong for this use case. With two machines running, both would poll the same device at the same time. Both would read the same Redis state. Both would detect the same transition and fire duplicate Telegram alerts and duplicate MongoDB writes.
I destroyed the second machine immediately and added max_machines_running = 1 to fly.toml to prevent it from coming back on future deploys.
Confirming It Works
The logs told the full story.
Health server on :8080
Initial check on startup
Checking Pompa Satelit
watt=0.0  volt=201.4  is_on=False  (prev=False)
no_change
Scheduler started, polling every 60 s
Then every 60 seconds after that, the same pattern repeated. The Tuya API was responding. The Redis state was loading correctly. The scheduler was firing on time.
The Cost Problem
A few minutes after the deploy I checked the Fly.io pricing page. The free tier for new accounts no longer exists. A shared CPU machine with 256 MB RAM running 24 hours a day costs about two dollars a month.
Two dollars is not a lot. But I already have a personal server sitting in my home network that runs all day and does very little. Moving the monitor there costs nothing and removes a monthly line item I did not need.
Moving to a Self-Hosted Server
I connected to my server over SSH and created a project directory placed inside a less obvious path, away from the default home directory listing.
mkdir -p /home/your-user/your-directoryI copied the source files using scp.
scp main.py monitor.py requirements.txt .env \
    your-user@your-server:/home/your-user/your-directory/
The server did not have the Python venv package installed, so I installed it first.
sudo apt install -y python3.12-venvThen I created the virtual environment and installed all dependencies.
cd /home/your-user/your-directory
python3 -m venv .venv
.venv/bin/pip install -r requirements.txt
Also Read: Kubernetes Logging Done Right: Fluent Bit to Elasticsearch
Keeping It Alive with Supervisor
My server runs inside a container environment without systemd. I installed Supervisor as the process manager. It handles auto-restarts and log rotation without needing a full init system.
sudo apt install -y supervisorI created a Supervisor config file for the monitor.
[program:smarthome-monitor]
command=/home/your-user/your-directory/.venv/bin/python main.py
directory=/home/your-user/your-directory
user=your-username
autostart=true
autorestart=true
startretries=10
stderr_logfile=/var/log/smarthome-monitor.err.log
stdout_logfile=/var/log/smarthome-monitor.out.log
stdout_logfile_maxbytes=10MB
stdout_logfile_backups=3
After reloading Supervisor and starting the program, the status showed RUNNING.
smarthome-monitor RUNNING pid 1234, uptime 0:01:00The error log confirmed everything was healthy.
Health server on :8080
Initial check on startup
Checking Pompa Satelit
watt=0.0  volt=199.8  is_on=False  (prev=False)
no_change
Scheduler started, polling every 60 s
Running job check_pompa_satelit at 2026-03-01 16:05:58 WIB
Checking Pompa Satelit
watt=0.0  volt=199.8  is_on=False  (prev=False)
no_change
Job check_pompa_satelit executed successfully
Useful Commands
These are the daily commands for managing the monitor on your server.
# Check status
sudo supervisorctl status

# View live logs
sudo tail -f /var/log/smarthome-monitor.err.log

# Restart the process
sudo supervisorctl restart smarthome-monitor

# Stop the process
sudo supervisorctl stop smarthome-monitor
What I Learned from This Build
This project reinforced a few rules I want to write down.
Polling daemons must run as a single instance. High availability is a trap for stateful workers. If your state lives in a shared cache like Redis, two workers racing against the same key will produce duplicates and corrupt your session data. One machine, always.
Secrets belong in environment variables. Whether you use Fly.io secrets, a .env file, or a secret manager, do not hardcode credentials. The code in this project never touches a credential directly. Everything comes from the environment.
Supervisor is the right tool for container environments without systemd. It does three things well. It starts your process, restarts it when it crashes, and writes logs. That is all you need for a background worker.
Running on your own server saves money and gives you full control. The migration from Fly.io to self-hosted took less than an hour and cost nothing extra. If you already own hardware, use it.
Final Thoughts
This monitor started as a curiosity about my electricity bill. It became a working system that gives me real data every day. The pump session history in MongoDB already shows patterns I could not see before. Peak usage hours, longer-than-expected runtimes, and energy costs that match my actual bill almost exactly.
The code is small and honest. Two files, six dependencies, no framework. It runs quietly in the background without any maintenance. When the pump turns on, I get a message. When it turns off, I get the cost estimate. That is everything I wanted from the beginning.
If you have a Tuya smart plug and a spare server, this stack is worth building for yourself.
Banner Image Prompt
For MidJourney, DALL-E, or Stable Diffusion.
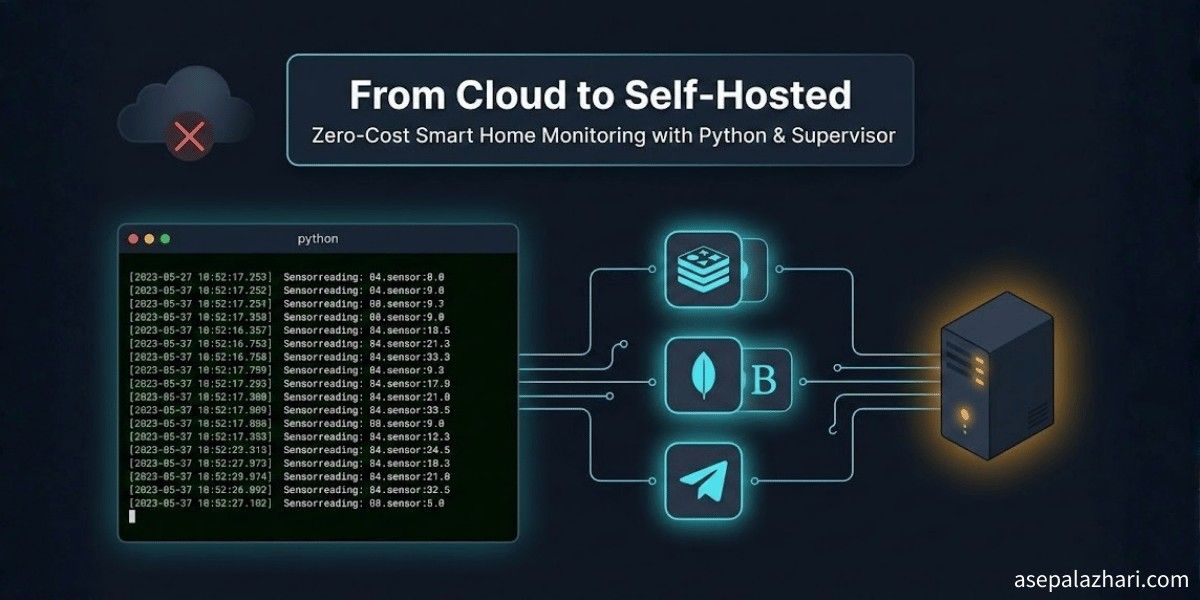
Prompt: A clean dark-themed 16:9 illustration showing a Python terminal with green scrolling logs on the left side. In the center, icons for Redis, MongoDB, and Telegram are connected by thin glowing lines. On the right, a compact personal server tower glows softly. A faded cloud icon with an X mark sits in the upper left corner, representing the move away from cloud hosting. Dark navy background, flat tech illustration style, no text in the image.
Banner title: From Cloud to Self-Hosted Banner subtitle: Zero-Cost Smart Home Monitoring with Python